Daily Creates June 14-26
Data visualisation:
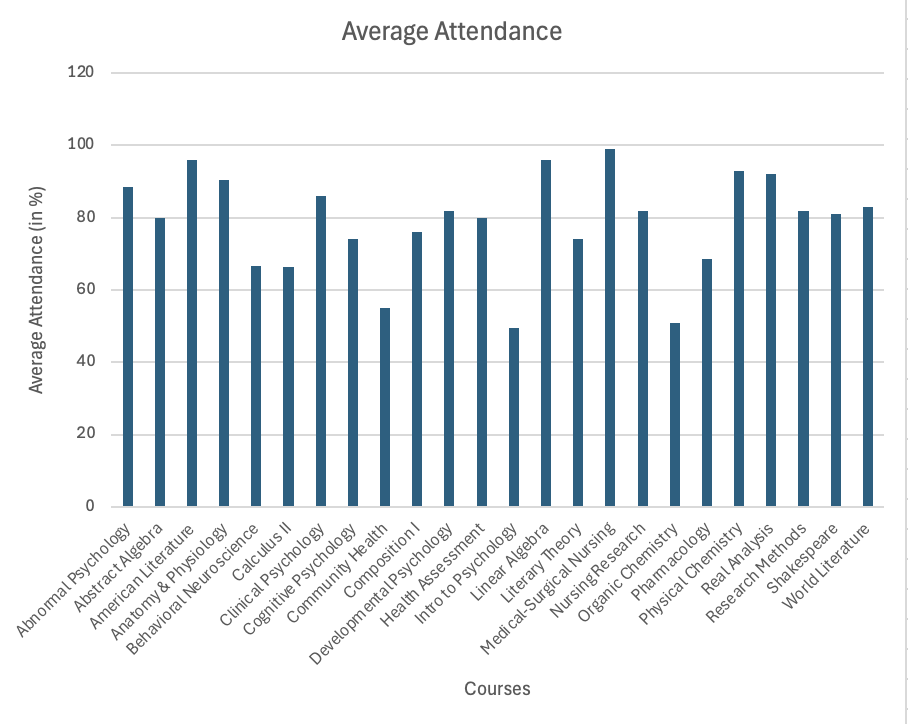
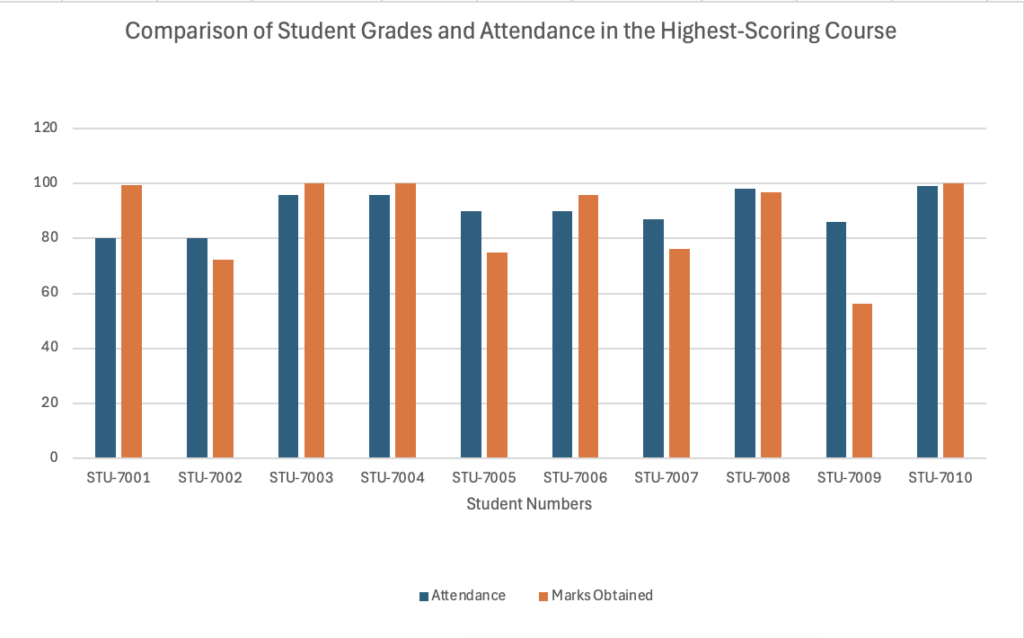
The dataset used for this analysis was obtained from https://trumpexcel.com/excel-sample-data/#Social-Media-Analytics-Dataset . I selected the Student Performance Dataset and used a subset of the student data for analysis. The data was analyzed and visualized using graphs to identify patterns and relationships, such as the comparison between student grades and attendance, or analyze average attendance in each course. During the design of the visualizations, I aimed to apply Mayer’s multimedia principles by keeping the visuals simple, relevant, and easy to interpret, minimizing unnecessary elements and presenting the information in a clear and organized manner.